When I am browsing through net today, I found an interesting article on Visual Representation of SQL Joins. I always draw this image in most of my SQL Trainings to explain Joins. I am so surprised to see this image :)
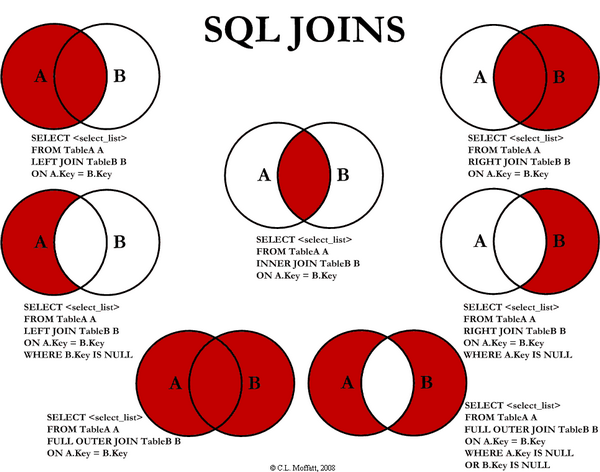
Venn Diagrams are the easiest way to explain different types of joins like Inner, Left, Right and so on.
It also helps us to easily understand the Set Operations like Union, Intersect and Minus in any Relational Database Queries.
Venn Diagrams are the easiest way to explain different types of joins like Inner, Left, Right and so on.
It also helps us to easily understand the Set Operations like Union, Intersect and Minus in any Relational Database Queries.
1 comment:
Good one, I remember these daigram when you use to explain me in trainee times
Post a Comment